PORTFOLIO

Visualization of Statistical Concepts Using R Software

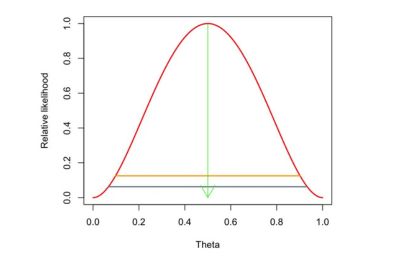
Here we considered the method of maximum likelihood estimation to estimate the parameters by graphical way, understanding the concept of consistency of estimators and visualizing it, estimation of parameters using simulated data and understanding the accuracy of the estimation with increasing sample size, etc.

Data Cleaning In SQL

Data cleaning is crucial in data analysis to ensure accuracy and reliability. It removes errors, inconsistencies and enhance data quality. Clean data facilitates meaningful insights, robust decision-making, and trustworthy results, ultimately optimizing organizational performance and efficiency. This Project contains Data Cleaning Process of Housing Trade Data.

Exploration of Covid Data

In my COVID data exploration project using SQL, I delved into diverse datasets to analyze pandemic trends. Employing SQL queries, I unearthed valuable insights on infection rates, geographical hotspots, and demographic patterns.

Bike Sales Dashboard

This project contains analysis of bike sales data using MS-Excel. Visualization is done by using Pivot Tables and Charts. Dashboard gives insights from the data for furthur working.